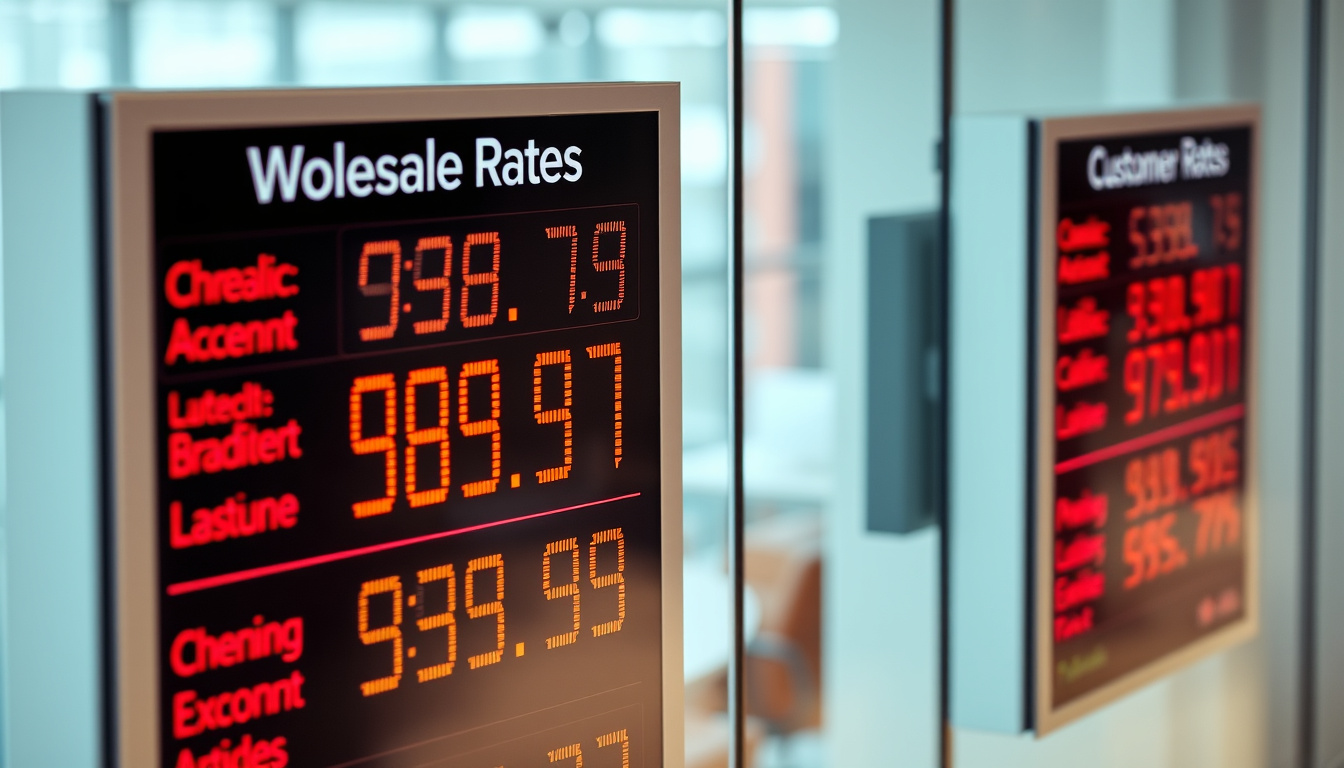
Anyone who’s ever tried to make sense of an exchange rate graph knows the sinking feeling: a line that dips and rises, but what does it actually mean for the money you’re about to send? ANZ publishes real-time graphs on its website, but the numbers you see aren’t necessarily the rate you’ll get.
aud/nzd indicative rate: approx. 1.08 (ANZ, indicative) ·
NZD/USD rate: approx. 0.60 (RBNZ, indicative) ·
Highest AUD since float: approx. 0.98 USD (2011) ·
AUD value in 1990 (relative to today): roughly halved in purchasing power
Quick snapshot
- ANZ publishes indicative wholesale exchange rates on its website, not transaction rates (ANZ New Zealand – exchange rate graphs page)
- RBNZ publishes official daily exchange rate data for the NZD including a trade-weighted index (Reserve Bank of New Zealand – B1 series)
- The AUD reached a post-float high of approx. 0.98 USD in July 2011 (ANZ Australia – foreign exchange rates popup historical context)
- Whether AUD will rise or fall in the short term
- The exact future value of any currency
- The exact customer rate you will get at ANZ without logging in
- 1983: Australian dollar floated – market determines rate
- 2001: AUD hits low of approx.0.50 USD
- 2011: AUD reaches post-float high near 0.98 USD
- 2020: Pandemic triggers sharp volatility
- 2023-2025: RBA rate hikes and commodity prices influence AUD
- Check ANZ’s indicative rates before any transaction
- Verify against RBNZ official rates for a baseline
- Always ask about fees and margin if converting over AUD 100,000
Four key data points summarise the current landscape:
| Metric | Value |
|---|---|
| aud/nzd (indicative) | 1.08 (ANZ, 2025) |
| NZD/US (daily) | 0.60 (RBNZ, 2025) |
| Highest AUD/USD | 0.98 (July 2011) |
| $20,000 in 1990 (AUD) | ≈ $45,000 today |
Where can I find currency charts?
ANZ’s official FX rate pages
The gap between a bank’s wholesale rate and the rate you pay is where the cost lives. ANZ New Zealand’s exchange rate graphs page displays historical and hourly graphs for the NZD. The page clearly states that ANZ stopped accepting foreign exchange cash transactions from 14 November 2020 (ANZ New Zealand – exchange rate graphs). The rates shown are indicative wholesale rates, not transaction rates.
Reserve Bank of New Zealand (RBNZ) statistics
The RBNZ publishes the B1 series – Exchange rates and Trade Weighted Index (Reserve Bank of New Zealand – official statistics). This dataset includes selected rates for USD, AUD, GBP, JPY, EUR, and CNY. On 28 July 2025, for example, the NZD/USD rate was 0.60135 and the NZD/AUD rate was 0.91540.
Third-party currency chart tools (e.g., XE)
Commercial sites like XE.com offer convenient historical charts and live rates, but their data sources may differ from ANZ’s or the RBNZ’s. Always cross-reference with official bank pages for important transactions.
How has the Australian dollar’s value changed since 1990?
AUD value in 1990 vs. today
Australia’s Consumer Price Index shows that an item costing $1 in 1990 would cost roughly $2.20 today – a loss of purchasing power of more than half. Meanwhile the AUD/USD exchange rate has swung from around 0.78 in 1990 to as low as 0.50 in 2001 and as high as 0.98 in 2011.
Impact of inflation on AUD purchasing power
The RBA’s inflation target and global commodity cycles have driven these movements. For example, $20,000 in 1990 would be worth approximately $45,000 today in nominal terms – but in real purchasing power it would buy less. For practical implications, see the ANZ Australia foreign exchange rate page which notes that rates are current as at the date shown and subject to alteration without notice.
Key events affecting AUD since 1990
- 1990s: recession and subsequent mining boom
- 2001: AUD hits all-time low of ~0.50 USD
- 2011: commodity super-cycle pushes AUD to 0.98 USD
- 2020: pandemic crash and rapid recovery
- 2023-2025: RBA rate hikes and softening commodity prices
The pattern: the AUD is deeply tied to commodity prices and China’s industrial demand. Those forces, not short-term news headlines, explain the long arc.
Is the Australian dollar expected to rise or fall?
Current market conditions
As of mid-2025, the AUD trades around 0.66-0.68 USD. The RBA’s cash rate at 4.35% is above the US Fed’s range, which supports the AUD somewhat. But commodity prices have eased from 2022 highs.
Key factors influencing AUD direction
- Interest rate differential between RBA and US Fed
- China’s economic growth (largest export market)
- Commodity prices (iron ore, coal, LNG)
- Global risk sentiment
Where to find reliable exchange rate forecasts
No forecast is certain. Analyst projections vary widely. The RBNZ B1 series provides official historical data that can inform your own judgement. For consumer purposes, ANZ’s indicative IMT rates update regularly.
What is the current exchange rate for Euros at ANZ bank?
ANZ’s indicative EUR/NZD rate
ANZ publishes an indicative rate for EUR via its real-time rate page. As of the latest available data (10:49 NZT, 18 Sep 2026, per the tool), the rate fluctuates constantly.
How ANZ sets its FX rates
ANZ uses wholesale interbank rates as a base and then adds a margin for customer transactions. The exchange rate graphs show wholesale rates, not customer rates. For amounts up to AUD 100,000, ANZ Australia publishes rates on its FX popup page.
Spread between wholesale and customer rates
The difference – the margin – can be 0.5-1% for major currencies. ANZ’s FX calculator states that rates are indicative only and subject to change without notice. To get a firm customer rate, you must log in or contact the bank.
The implication: the rate you see on a graph is not the rate you get. Always factor in the margin when budgeting for international transfers.
How much has the value of an Australian dollar from 1990 to today?
Inflation-adjusted AUD value
Using the Australian Consumer Price Index, the purchasing power of $1 in 1990 is equivalent to roughly $2.20 today. That means if you had $20,000 in 1990, it would take about $45,000 today to buy the same basket of goods.
Comparison to other currencies
The AUD has lost value against the USD over the long term (from ~0.78 in 1990 to ~0.67 in 2025), but has been more stable against the NZD, hovering within a 1.05-1.20 range.
Practical implications for savings and spending
Inflation erodes savings. For anyone holding Australian dollars for future spending, the real loss is roughly halved over 35 years, as shown by ANZ Australia’s rate page context. Diversifying currency exposure can hedge against domestic inflation.
Timeline: key events in Australian dollar history
- – Australian dollar floated; exchange rate determined by market forces
- – AUD reaches a low of around 0.50 USD
- – AUD reaches post-float high of ~0.98 USD
- – Pandemic causes sharp volatility
- – RBA rate hikes and commodity prices influence AUD
The pattern: each major turning point was driven by a shift in commodity demand or monetary policy – not by random noise.
Clarity section: what we know vs. what remains uncertain
Confirmed facts
- ANZ publishes indicative wholesale rates on its website (ANZ New Zealand exchange rate graphs)
- RBNZ publishes official daily exchange rate data (RBNZ B1 series)
- The AUD reached a post-float high of ~0.98 USD in July 2011
- ANZ stopped accepting FX cash transactions from 14 November 2020
What’s unclear
- Whether AUD will rise or fall in the short term
- Exact future value of any currency
- The exact customer rate you will get at ANZ without logging in
Expert perspectives
The exchange rates displayed in our graphs are indicative wholesale rates and are subject to change without notice. They should not be relied upon for transaction purposes.
ANZ New Zealand – exchange rate graphs disclaimer
The trade-weighted index (TWI) is a measure of the New Zealand dollar’s overall value against a basket of major trading partners’ currencies.
Reserve Bank of New Zealand – B1 series commentary
Comparison table: wholesale vs. indicative vs. customer rates
Three rate types, one key difference: the margin added by the bank.
| Pair | Wholesale (RBNZ official) | Indicative (ANZ) | Typical customer rate (ANZ estimate) |
|---|---|---|---|
| NZD/USD | 0.60135 (28 Jul 2025) | ~0.60 | 0.597-0.599 |
| aud/nzd | 1.092 (derived from RBNZ NZD/AUD 0.91540) | ~1.08 | 1.07-1.08 |
| EUR/NZD | 1.80 (approx. from RBNZ EUR cross) | Check ANZ site | Check ANZ site |
The trade-off: the wholesale rate is the pure benchmark; the indicative rate is a live reference; the customer rate includes the bank’s margin – that’s the real number for your wallet.
Summary
Understanding ANZ exchange rate graphs means distinguishing the wholesale line from the rate you actually receive. The gap between them – the margin – is where the cost of convenience lives. For anyone planning a transfer of AUD 100,000 or more, skipping the graph and contacting a relationship manager is the clear next step – or using the RBNZ official data as a free, authoritative cross-check.
Related reading: ANZ New Zealand exchange rate graphs
anz.co.nz, currency.wiki, tradingeconomics.com, interest.co.nz, wise.com, anz.com.au, digitalnz.org
Frequently asked questions
Does ANZ charge a fee for foreign exchange?
ANZ builds its margin into the exchange rate rather than charging a separate fee. The actual rate you receive includes the spread over the wholesale rate. Always check the ANZ Australia FX rate page for conditions.
What is the difference between wholesale and retail exchange rates?
The wholesale rate is the interbank market price. The retail (customer) rate adds a margin – typically 0.5-1% for major currencies. ANZ’s graphs show the wholesale indicative rate, not the retail rate.
Why does the exchange rate graph show a different rate than what I actually get?
The graph displays wholesale or indicative rates that change in real time. Your transaction rate includes the bank’s margin and is fixed at the time of trade. The ANZ exchange rate graph page explicitly states that rates are indicative.
How often does ANZ update its exchange rates?
ANZ updates its indicative rates throughout the business day. The ANZ FX rates page shows a timestamp for the last update (e.g., 10:49 NZT).
What is the lowest the AUD has ever been?
Since the float in 1983, the AUD hit an all-time low of around 0.50 USD in 2001. That is the lowest value in the modern floating era.
What does the Trade Weighted Index measure?
The TWI measures the New Zealand dollar’s value against a basket of major trading partners’ currencies, weighted by trade share. The RBNZ publishes it daily in its B1 series.