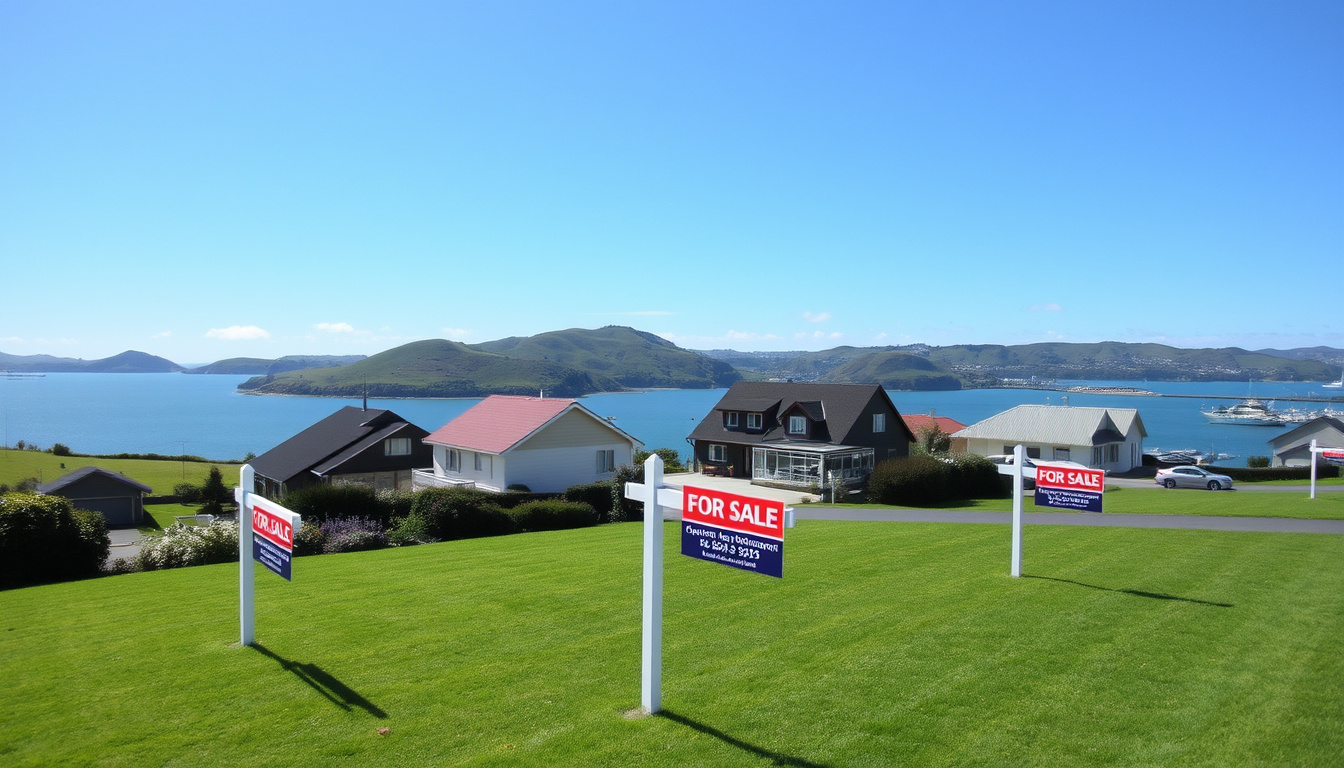
Whangarei, the northernmost city in New Zealand, offers prospective homebuyers a distinct mix of urban conveniences and coastal lifestyle options. As the commercial centre of the Northland region, the city attracts families, investors, and retirees seeking more affordable alternatives to larger metropolitan markets. Property values in the area have followed national patterns while maintaining characteristics unique to the local economy.
Current market data reveals opportunities across various price brackets, from entry-level options to premium waterfront estates. Suburbs within the Whangarei District present different value propositions depending on proximity to amenities, school zones, and coastline access. Understanding the recent trajectory of prices, rental returns, and suburb-level variations helps buyers make informed decisions in a market that has undergone significant correction since its 2021 peak.
This guide examines the latest market statistics, suburb comparisons, and practical considerations for those exploring houses for sale in Whangarei. Information draws from quarterly property value assessments, REINZ transaction data, and rental market surveys conducted through late 2025 and early 2026.
Current Houses for Sale in Whangarei
Average House Price
$732,730
Quarterly Change
-0.40%
Annual Growth
+0.43%
Avg Weekly Rent
$580/week
The Whangarei property market presents a nuanced picture for prospective buyers navigating current conditions. Several factors shape local demand and supply dynamics.
- Prices have declined 19.24% from the December 2021 peak, creating a correction that has brought values closer to long-term trend lines
- The market sits approximately 4.36% below its cycle bottom, suggesting potential buying opportunities for longer-term holders
- Rental yields have strengthened as property values adjusted more sharply than rental rates
- Central suburbs and coastal areas offer distinct lifestyle trade-offs alongside different price points
- Capital values serve as common price guides, with transactions occurring near or above CV in growth corridors
- Northland-wide, Kaipara District trades +7% above CV while Far North sits -5% below regional averages
| Metric | Current Value | Context |
|---|---|---|
| Average House Price | $732,730 | January 2026 (QV data) |
| 3-Month Change | -0.40% | Modest softening |
| 12-Month Change | +0.43% | Stabilising trend |
| Peak-to-Present | -15.76% | From December 2021 |
| Trough-to-Present | +4.30% | From August 2025 |
| Average Weekly Rent | $580 | December 2025 |
| Annual Rent Change | -2.52% | $15/week decline |
| 20-Year Annual Growth | +3.89% | January 2006-2026 |
House Prices and Market Trends in Whangarei
Understanding the cyclical nature of Whangarei property values requires examining both recent corrections and longer-term growth patterns. The market has transitioned through distinct phases that inform current conditions and future expectations.
Price Cycles and Recent Corrections
Property values in Whangarei reached their peak in December 2021, marking the culmination of a post-pandemic surge that pushed prices significantly above traditional trend lines. From that peak, the market entered a sustained correction phase, declining 19.24% to reach its lowest point in August 2025. This pullback brought prices back to levels more consistent with underlying economic fundamentals and long-term growth trajectories.
The subsequent recovery has been measured. Current prices sit 4.30% above the August 2025 trough, representing early signs of stabilisation rather than renewed speculative momentum. The market remains 15.76% below the 2021 peak, indicating that buyers who entered near the cycle bottom may have captured meaningful value, particularly for properties held over multi-year horizons.
Market Valuation Assessment
Analysis indicates the Whangarei market is approximately 4.36% below its cycle bottom from a valuation perspective. This suggests properties may trade at a modest discount to intrinsic value, creating potential opportunities for buyers with longer time horizons. However, valuation signals warrant consideration alongside other factors including interest rate expectations, employment conditions, and migration patterns.
Properties in Whangarei frequently list at capital value as a price guide. Comparing recent sales prices against CV provides insight into whether individual properties trade above, at, or below market value. This approach helps identify properties that may offer stronger value propositions relative to neighbourhood averages.
National Context and Regional Performance
Nationwide median prices reached approximately $795,000 by mid-2025, representing 3.2% year-on-year growth according to REINZ data. Against this national backdrop, Whangarei has underperformed slightly on a quarterly basis, with regional declines ranging from -1.1% to -0.4% depending on the measurement period. This relative softness reflects both the earlier magnitude of the local boom and ongoing adjustment to sustainable price levels.
The REINZ House Price Index for Whangarei District showed the index at approximately $3,847 in March 2024, with rolling six-month trends indicating modest stability. Nationally, REINZ reported sales volumes down 27.4% month-on-month in December 2024, though seasonally adjusted figures showed a 1.8% year-on-year increase. These national patterns influence buyer confidence and lending conditions that extend to regional markets.
Best Suburbs for Buying Houses in Whangarei
Whangarei encompasses diverse neighbourhoods ranging from established central areas to coastal settlements. Property values, lifestyle characteristics, and investment potential vary considerably across these communities, making suburb selection a critical factor in the purchasing decision.
Premium Suburbs and Growth Leaders
One Tree Point stands out as Whangarei’s most expensive suburb with an average property value of $1,067,350 as of early 2026. This coastal area has demonstrated consistent strength, recording 3.13% growth over 24 months—the fastest appreciation rate among 26 suburbs tracked in the region. The premium positioning reflects waterfront access, established infrastructure, and sustained demand from buyers prioritising lifestyle attributes.
Other suburbs with strong long-term appreciation include growth corridors where 20-year data shows the most significant value increases. These areas appeal to buyers seeking both quality of life and potential capital gains, though prices in established growth zones may already incorporate expectations for future appreciation.
Affordable Options and First-Home Opportunities
Raumanga represents the most accessible suburb for property buyers, with average values around $462,550. This price point positions the area within reach of first-home buyers and those seeking rental investments with lower entry costs. Central Whangarei homes, particularly three-bedroom family options, typically trade in similar ranges depending on condition and specific location.
The gap between Whangarei’s most expensive suburb (One Tree Point at $1,067,350) and most affordable (Raumanga at $462,550) spans approximately $600,000. This significant range reflects varying proximity to coastline, age of housing stock, and neighbourhood development patterns. Buyers should evaluate whether lifestyle preferences justify premium pricing in specific suburbs.
| Suburb | Average Value | Notable Characteristics |
|---|---|---|
| One Tree Point | $1,067,350 | Highest prices, coastal location, strongest 24-month growth |
| Raumanga | $462,550 | Most affordable, central location |
| Central Whangarei | Variable | Three-bedroom family homes in moderate ranges |
Regional Valuation Variations
Property-to-CV ratios differ meaningfully across the broader Northland region. Kaipara District trades approximately 7% above capital value, indicating buyer competition and confidence in local market fundamentals. In contrast, Far North District sits about 5% below CV, suggesting more balanced conditions or softer demand in outlying areas. Whangarei itself occupies middle ground, with transactions occurring near capital values in most neighbourhoods.
New Homes and Developments in Whangarei
While comprehensive data on specific new developments remains limited, broader market indicators suggest ongoing interest in both established housing stock and newer constructions. Properties across Whangarei frequently use capital value as a price guide, with actual transactions completing near or above CV in growth-oriented suburbs.
Property Types and Market Availability
The housing stock in Whangarei includes options suitable for various buyer profiles. Three-bedroom family homes in central areas represent a significant portion of available inventory, appealing to owner-occupiers prioritising space and accessibility. Waterfront properties concentrate in premium suburbs like One Tree Point, where higher values reflect both location desirability and limited supply.
Investment-oriented buyers may find rental yield opportunities in more affordable suburbs where entry costs remain lower. The average weekly rent of $580 places Whangarei rental properties within reach of median-income tenants while providing returns that have historically supported investment cases, particularly during periods of price correction.
Direct data on active listings, days on market, and detailed new development projects was not available in current market surveys. Buyers seeking real-time inventory information should consult local real estate agencies or property listing platforms for the most current availability and pricing. Market conditions can shift rapidly based on seasonal patterns and broader economic factors.
Investment Considerations
Rental market data from December 2025 shows average weekly rents at $580, representing a decline of $15 per week or 2.52% year-on-year. Despite this softening, rents have increased $60 per week (2.77% annually) over the longer period from December 2021 to 2025. This longer-term growth trajectory suggests underlying rental demand remains present even as recent data shows modest correction.
For investment purchasers, the combination of relatively lower entry prices compared to peak levels and historically positive rental growth presents considerations worth evaluating against individual circumstances and financial objectives.
Whangarei Property Market Timeline
The Whangarei property market has traversed distinct phases over recent years, shaped by national economic conditions, interest rate movements, and regional factors unique to Northland.
- December 2021 — Property values reach peak levels, marking the culmination of post-pandemic price acceleration that significantly exceeded long-term trend lines
- 2022-2024 — Market enters correction phase as interest rates rise and buying capacity diminishes across the residential property sector
- August 2025 — Prices reach cycle bottom, having declined 19.24% from peak levels established nearly four years earlier
- Late 2025 — Early stabilisation signs emerge as prices begin recovering from trough levels, posting 4.30% improvement from the bottom
- January 2026 — Current market position shows prices 15.76% below peak but demonstrating renewed stability and modest upward momentum
What We Know and What Remains Unclear
| Established Information | Information Requiring Further Verification |
|---|---|
| Average price: $732,730 (January 2026) | Precise active listing counts and inventory levels |
| Peak-to-trough decline: 19.24% | Specific new development projects and availability |
| Current recovery: +4.30% from trough | Detailed suburb-level transaction volumes |
| One Tree Point premium positioning | Short-term interest rate trajectory impacts |
| Rent at $580/week average | Migration patterns and population changes |
| Raumanga as most affordable suburb | Future infrastructure investments affecting values |
Understanding Whangarei as a Property Market
Whangarei functions as the primary economic and administrative centre for Northland, New Zealand’s northernmost region. The city serves a catchment area extending beyond its own boundaries, providing retail, healthcare, education, and professional services to surrounding rural communities. This regional role supports underlying demand for housing within reasonable commuting distance of the city centre.
The property market’s post-COVID trajectory reflects patterns observed across New Zealand, with the 2021-2025 correction bringing prices back toward sustainable levels relative to income and rental returns. The Northland region’s proximity to Auckland has historically influenced buyer behaviour, with some purchasers attracted by lower entry costs while maintaining employment connections to the larger metropolitan area.
Sources and Market Data
Property market information in this guide draws from multiple authoritative sources tracking New Zealand residential real estate. The QV monthly house price index provides property valuation benchmarks updated regularly throughout the year. REINZ (Real Estate Institute of New Zealand) contributes transaction data, house price indices, and sales volume statistics gathered from property settlements across the country.
The REINZ House Price Index for Whangarei District showed the index at approximately $3,847 in March 2024, with national comparisons showing +2.6% year-on-year growth during the same period.
Additional market intelligence comes from specialist property analysis services that track individual suburb performance, rental yields, and valuation deviations from historical averages. These sources collectively provide a comprehensive view of conditions affecting buyers, sellers, and investors in the Whangarei property market. Those exploring current property listings can cross-reference market data against actual available inventory.
Summary: Key Takeaways for Whangarei Property Buyers
The Whangarei property market presents a mix of opportunities and considerations for prospective purchasers. Prices have undergone significant correction from 2021 peaks, with current values sitting below cycle highs while demonstrating early recovery momentum. The market appears modestly undervalued relative to its recent bottom, potentially favouring buyers with longer investment horizons.
Suburb selection significantly influences both purchase price and lifestyle outcomes. Premium coastal areas command substantial premiums while more central suburbs offer accessibility at lower price points. Understanding the trade-offs between location, property condition, and price helps buyers identify options aligned with their priorities and budget constraints.
Those exploring the Whangarei market benefit from comparing current conditions against broader national trends, evaluating rental yield potential, and assessing how individual property characteristics align with personal circumstances. Market data provides a foundation for decision-making, though individual property inspections and local agent expertise remain essential components of any purchase process.
For readers comparing regional markets, understanding how Whangarei compares to neighbouring areas may prove valuable when broadening property search criteria.
Frequently Asked Questions
What is the average house price in Whangarei?
The average house price in Whangarei was $732,730 as of January 2026, according to QV property data. This represents a modest decline of 0.40% over the preceding three months and a slight increase of 0.43% over the past twelve months.
Which Whangarei suburb has the highest property values?
One Tree Point holds the position of Whangarei’s most expensive suburb with an average property value of $1,067,350. This coastal area has also demonstrated the strongest growth among 26 tracked suburbs, appreciating 3.13% over a 24-month period.
What is the most affordable suburb in Whangarei?
Raumanga represents the most affordable suburb in Whangarei with average property values around $462,550. This price point makes the area accessible for first-home buyers and those seeking lower-cost investment properties.
How has the Whangarei property market performed since its peak?
Whangarei property prices peaked in December 2021 and subsequently declined 19.24% to reach a cycle bottom in August 2025. Current prices remain 15.76% below the peak level but have recovered 4.30% from the trough.
What is the average weekly rent in Whangarei?
Average weekly rent in Whangarei was $580 as of December 2025. While this represents a decline of $15 per week (2.52%) year-on-year, rents have increased $60 per week over the longer period from December 2021 to 2025.
Is the Whangarei property market currently undervalued?
Analysis suggests the Whangarei market is approximately 4.36% below its cycle bottom from a valuation perspective, potentially indicating buying opportunities for purchasers with longer-term horizons. However, valuation signals should be considered alongside other market factors.
What long-term growth has Whangarei property demonstrated?
Over the 20-year period from January 2006 to January 2026, Whangarei property values grew at an average annual rate of 3.89%. This long-term trend provides context for evaluating shorter-term cyclical movements.